More Developers, More Problems
How do we reduce bugs in software? The conventional wisdom is wrong, and the data will surprise you.
Software developers widely believe that more code equates to more bugs. The exact relationship is not well-understood, but many assume it to be linear (i.e. "bugs per thousand lines of code"). However, the top 100,000 most popular GitHub repositories show no such constant relationship between lines of code and issues. Further, lines of code is not a reliable indicator of (reported) bug count.1
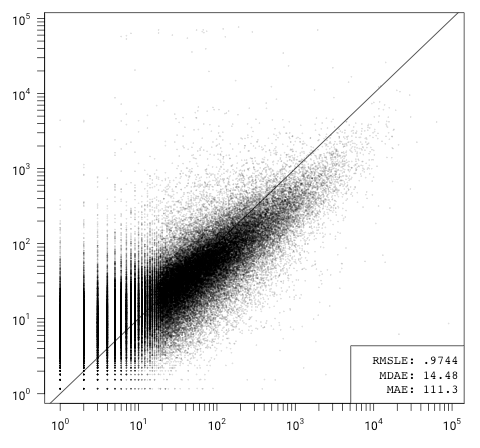
There are two more reliable indicators: the number of developers who have contributed code, and the number of commits. Pictured here is a model that uses just these two variables and performs nearly as well at predicting bug count as a model using all 16 variables I collected. I'll explain how I arrived at these models, but first:
What does this mean for reducing bugs, if the relationships are causal?
If you require reliable software, don't use bug-producing methodologies. For example, Agile prescribes getting straight to writing code and iterating on that code to refine requirements, leading to more commits (which are correlated with more bugs).
Prototypes can reduce bugs, but only if they're thrown away. You can expend commits learning a technology or learning your customer's requirements and then write a non-prototype version with fewer commits and/or a smaller team.
Extra work intended to make a system more reliable might have the opposite effect. Test-driven development and unit tests could counterintuitively lead to more bugs if using them results in more commits or requires adding more developers to the project.
For individuals, spend more time on activities other than writing code. Think, design, prototype, etc.
For businesses, hire a smaller number of more experienced developers.
Collecting the Data
You can download the data I used to build the models if you want to follow along.
I began by querying the GitHub API for information on the 100,0002 most popular projects (those with more than 135 stars). Rather than a random sample, these projects make up the top 0.1% and give us more confidence that enough people are using them to discover and report bugs.3 For each project, I extracted the date it was created (on GitHub), how many stars it has, the number of issues, the number of pull requests, and whether the issue tracker is disabled.
Next, I cloned all the associated non-private repositories and collected the following stats directly from Git and the filesystem:
- first commit date/time
git log "--pretty=format:%aI" | tail -1- # of commits to any branch
git rev-list --count --all- # of branches4
git branch -r --list | wc -l- # of contributors5
git shortlog -sn | wc -l- # of directories
find . -not -path "./.git*" -type d | wc -l- # of files
find . -not -path "./.git*" -type f | wc -l
Finally, I gathered Tokei statistics against the HEAD of each repository: lines of code, comments, blanks, etc. for each detected language.6 Then, for each language detected by Tokei, I counted the total bytes and LZMA-compressed bytes for that language group.7
Controlling for Popularity
We'd expect older projects and more popular projects to have, on average, more opened issues than newer or less popular projects of a similar size. To control for these and other differences, I used the following model:9
β6 ⋅ ln(code) + β7 ⋅ ln(comments + 1) + β8 ⋅ ln(pull requests + 1) + β9 ⋅ ln(files) + ε
I fit and tested the fit of the model with linear regression across 10-fold cross validation, plotting the prediction error of each fold in a single combined plot. Before doing so, I eliminated all private, archived, mirrored, and forked projects; projects with the issue tracker disabled; and projects with 0 issues from the data set.
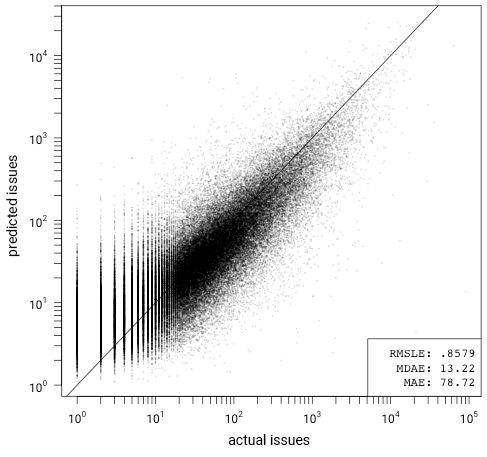
The model is skewed, but otherwise appears to be a good fit. It overestimates the number of issues for projects with a small (< 10) number of GitHub issues (and conversely underestimates issues on the high end). I suspect that this is due to forks that are not marked as forks in GitHub's API and projects that include third party code directly in the repository (rather than via build-time dependencies). These projects will have inflated Git statistics relative to issue tracker participation, the extreme cases of which are forks of the Linux kernel. This skew is even more pronounced for models that only consider code size:
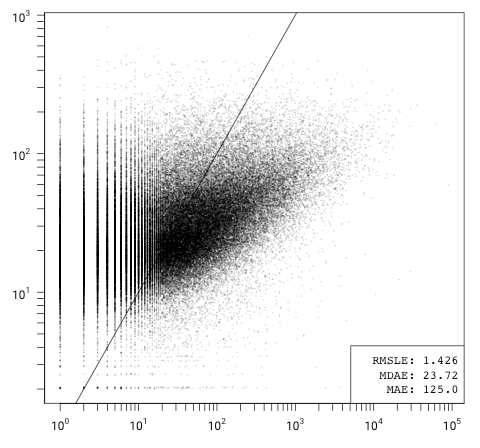
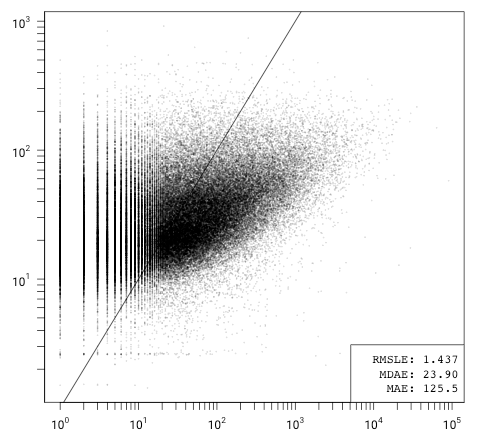
Fitting the 9-variable model to the full set gives the following approximation:
0.072 ⋅ ln(code) + 0.034 ⋅ ln(comments + 1) + 0.413 ⋅ ln(pull requests + 1) – 0.069 ⋅ ln(files) – 1.690
We can see that the dominant variables in the model are the number of pull requests (0.413), the number of stars (0.315), and the number of commits (0.266). Compare this to the number of lines of code (0.072) and comments (0.034) and note that the difference is even more pronounced when we consider that the variables have not been normalized and lines of code are higher than pull requests, stars, or commits for almost all projects.
Since pull requests and stars are GitHub-specific features, I also built a model without them (or the GitHub creation date). Then, based on the fitted model's coefficients, I further simplified it to just contributors and commits. This 3-variable model performs nearly identically to the other, and it can be explored on a 3D graph.
β3 ⋅ ln(all commits) + β4 ⋅ ln(code) +
β5 ⋅ ln(comments + 1) + β6 ⋅ ln(files) + ε

What If the Model Is Wrong?
Now that we know that impact of contributors and commits, we can look at how lines of code relate to issues without using any model by producing a group of simple plots faceted by contributors and commits.
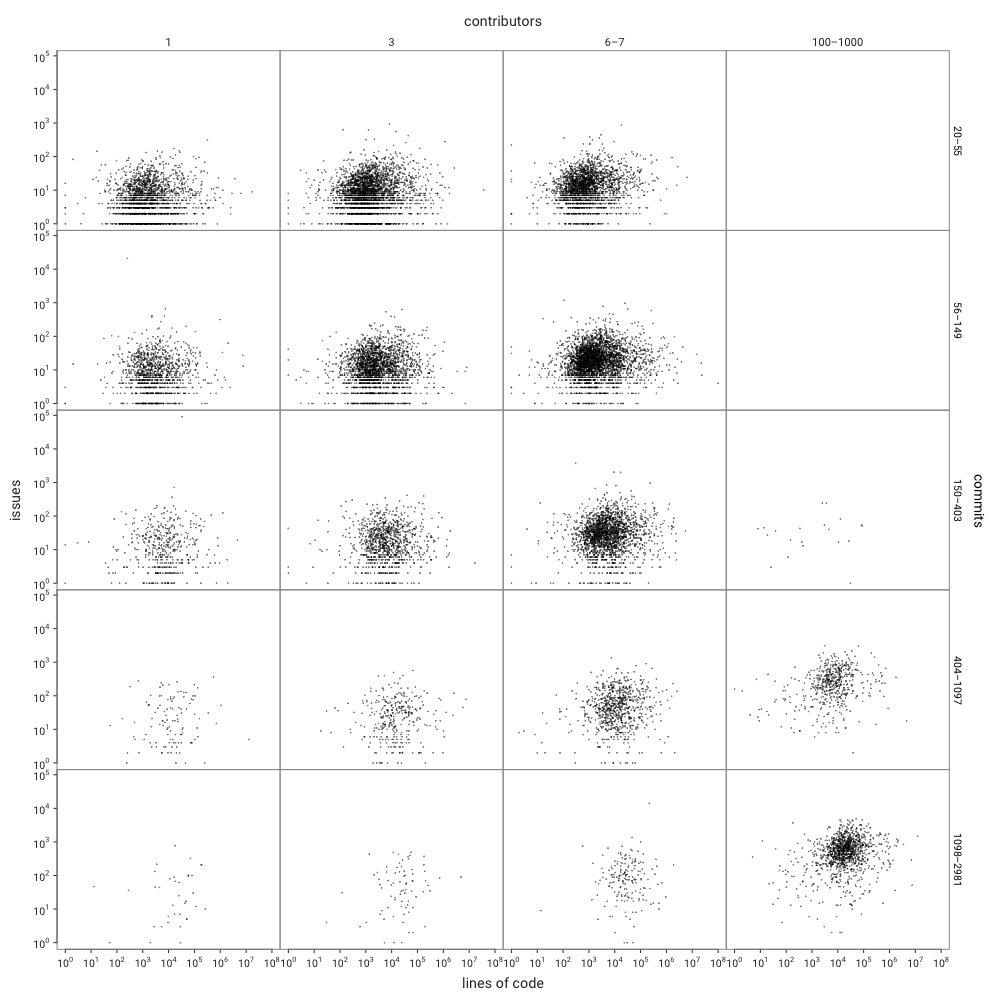
If all you see are blobs, that's to be expected: this visually confirms that the correlation between lines of code and issues is very weak. Remember though that we're also looking at a logarithmic scale in these groupings, and the model uses ln(code): that's because the correlation varies based on the size of the code.
As Code Grows, Bugs Grow More Slowly
I've seen quotes that there are anywhere from 0.5 to 50 bugs per thousand lines of code. But the few studies I've found with conclusions like these only looked at one or two mature software projects, either at a single point in time or between two releases. How does looking at a snapshot in time imply that the ratio was the same earlier in the project or will hold constant later in the project's life?
Based on the data, it's not sensible to talk about any constant relationship between bugs and lines of code. Instead, we should recognize that (reported) bugs accumulate more slowly as a project matures. What could account for this? Some ideas are:
Observed frequency is distributed logarithmically, not normally. A small number of bugs are noticed sooner and more frequently than the "long tail" of bugs in the system.
Bug reports scale with features, not lines of code, while lines of code scale superlinearly with features. (As projects grow, the number of lines of code required to add new features increase.)
A project's core gets more stable over time, as it receives bug fixes without many major changes. As a project matures, new developers are less likely to make changes to critical code paths, and new feature development requires fewer core changes.
What About Bugs that Aren't Issues and Issues that Aren't Bugs?
GitHub issues are the best proxy for bugs that I know of for a study of this size and scope. Automatic bug detection software is applicable only to certain languages and detects only "structural" bugs (e.g. invalid memory access) rather than logical bugs (e.g. incorrect calculations), and manual bug counting is impractical (if even possible). We have to assume that open issues are, on average, representative of the number of bugs experienced by users.
Outliers and Alternative Hypotheses
Before looking at the data, I would not have guessed that bugs could be predicted so well by the number of contributors alone. This suggests that the number of contributors to a project embeds a significant amount of other information about the project. One possible explanation for this is that large development teams regress to the mean: As the number of contributors increases, projects gravitate towards some universal average commits/features/lines-of-code-per-developer ratio.
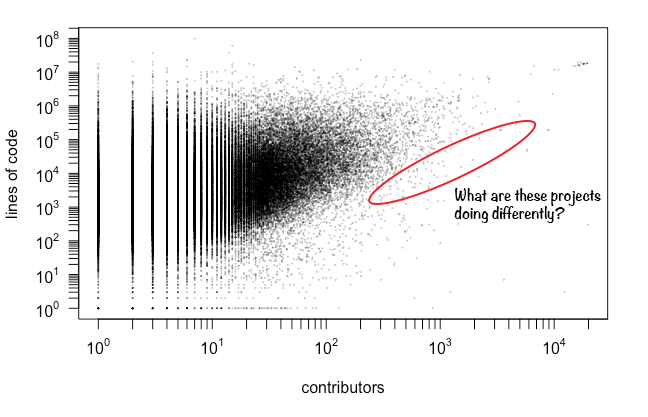
While looking through outliers, I came across one particularly interesting class: video game console emulators. Due to the availability of test inputs (games), testers (gamers), and other implementations (other emulators and the system itself), emulators might provide a more controlled laboratory for future comparative studies about software bugs.
- ^ Throughout this article I use "bug" to refer to some unexpected behavior of software, from the perspective of a user, such as: crashes, visual anomalies, incorrect data, etc. "Bug" is also commonly used to describe an exploitable defect in software, from the perspective of an attacker. This article does not address such security bugs, which might follow a different model.
- ^ I crawled the 109,105 top projects (136 stars and above) between 2019-02-14 07:12:29+00 and 2019-02-16 00:07:24+00. 108,756 had repositories, the other were either empty or had encountered a git clone error. Rather than retry these I excluded them from the analysis. I also excluded projects that were marked as either archived, a fork, a mirror, or private, as well as projects that had the issues tracker disabled or had 0 issues, leaving 94,529 projects.
- ^ Since I only looked at the most popular repositories, the models and conclusions might not generalize well to less popular repositories.
- ^ The number of branches includes
HEAD. - ^ The number of contributors as determined by Git commits is not the same as the number of listed contributors on GitHub.
- ^ Tokei detects language by file extension which excludes files with non-standard or missing extensions and some obscure file types.
- ^ LZMA compression was done via the "lzma" command on Linux with compression level 3 and no headers (
xz --format=raw -3). Each file was grouped by language and concatenated before compression. - ^ You could make a case for excluding further languages like JSON, XML, and Autoconf, or for including Html. However, changes beyond eliminating Text did not seem to have a significant impact on the model.
- ^ A model using all 16 variables performed the same as this 9-variable model, which I reduced the full model to here for simplicity.